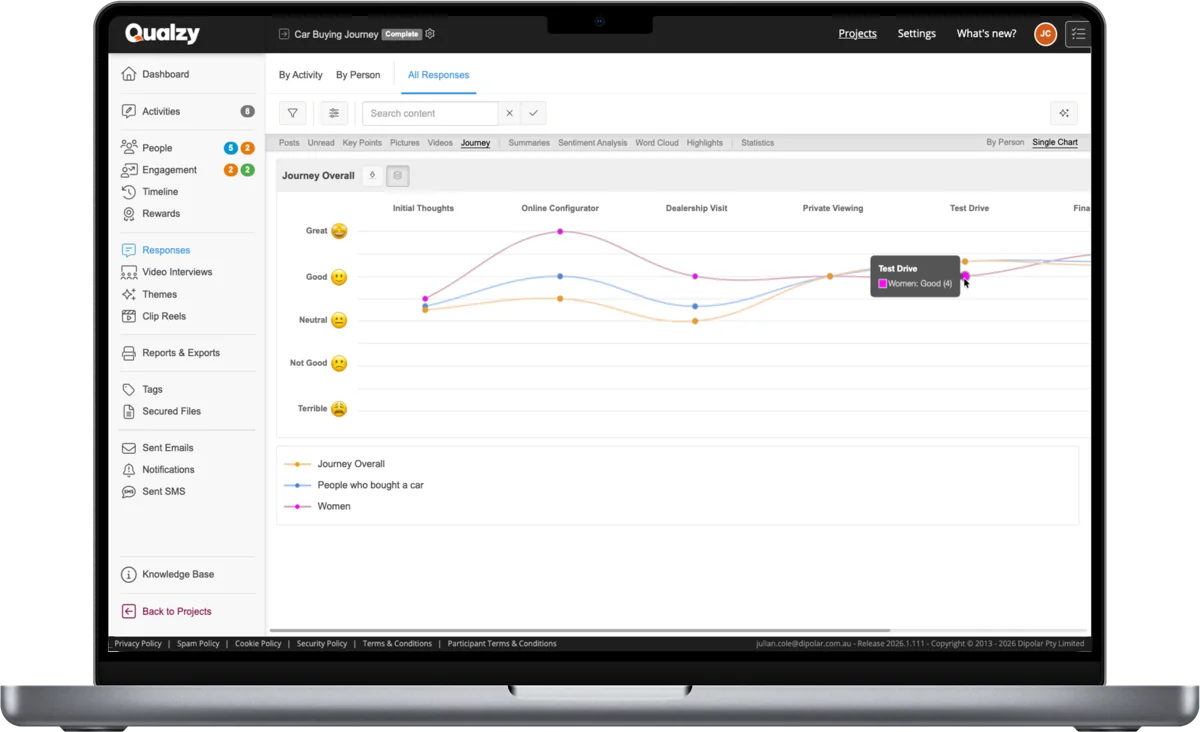
Segment Comparison
See exactly where
segments diverge.
Overlay different segments onto a single chart - age groups, user types, purchase behaviour, demographics - and watch where their experiences align and where they split apart. These are the moments that matter most to your client.
Any filter, any segment
Use the full power of the responses window to isolate and compare specific groups
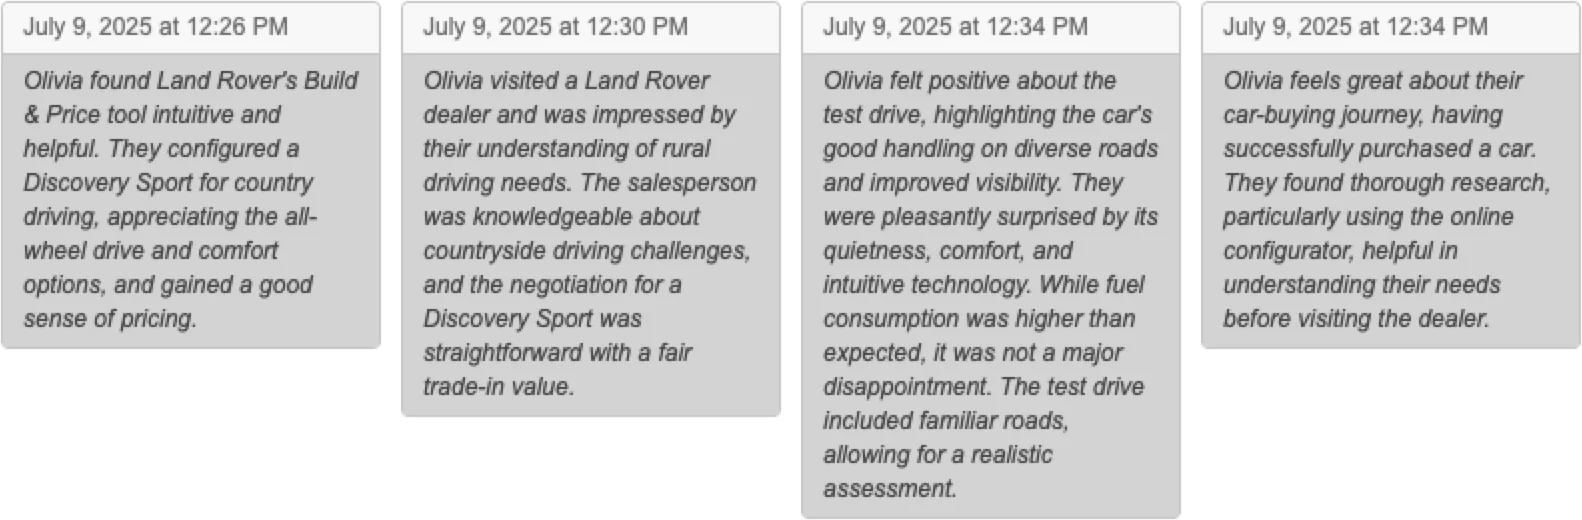
Participant-rated data points
Every point on the chart is a score the participant gave themselves - no AI-inferred sentiment, no guesswork
Unlimited segments
Overlay as many groups as you need - demographics, behaviours, purchase outcomes, custom screener answers
Export-ready for any presentation.
Every journey chart and segment overlay exports as a high-quality image with one click - ready to drop straight into a client deck, report, or stakeholder slide without any reformatting.